In July 2001, U.S. Census data showed that Hispanics surpassed blacks as the largest minority group in the United States. Hispanics make up about 14% of the U.S. population today and the Census Bureau predicts that, based on continued immigration and birth rates, they will constitute 25% by 2050. An aggregate of 2004 and 2005 data from ║┌┴¤═°'s annual Minority Relations poll* allows a close look at the major religious and political affiliations of Hispanic Americans.
Religious Identity
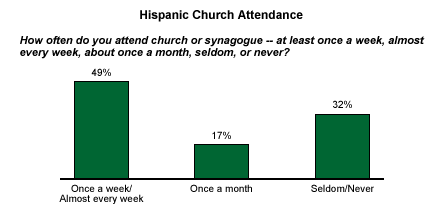
Forty-nine percent of Hispanics say they attend services once a week or almost every week and another 17% attend at least once a month. One-third of Hispanics (32%) say they seldom or never attend church. Looking at an aggregate from surveys conducted in 2004, 44% of Americans say they attend once a week or almost every week and 10% attend at least once a month; 41% say they seldom or never attend. Hispanics are slightly less likely than the overall population to say they seldom or never attend.

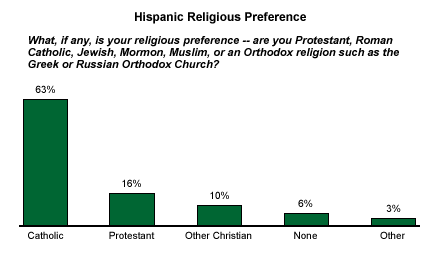
Nearly two-thirds of Hispanics (63%) self-identify as Catholic, while 16% say they are Protestant. Another 10% align with other Christian faiths; just 6% say they have no religious affiliation at all. About 9 in 10 Hispanics identify with a Christian religion, which is slightly higher than the 84% of Americans in general.

"Although nearly all Hispanics arrive in this country as Catholics, so many more options are available to them when they get to the United States," says the Rev. Javier Diaz-Munoz, a priest who works closely with the Hispanic community in New Jersey. "Protestant churches, especially, are very active here. They offer a lot of social services to Hispanics."
Diaz-Munoz sees attendance increasing in his diocese, especially at the Spanish-language services. "Several years ago, we conducted mass in Spanish in 14 parishes; today there are 19. In Trenton alone, where the majority of Hispanics are from Mexico and Guatemala, we get 500 to 600 people at Spanish language services every Saturday and Sunday."
Political Identity
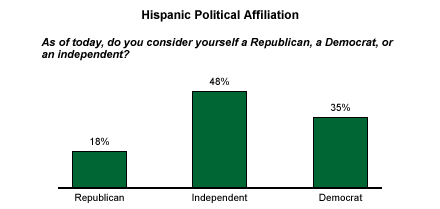
The effect of the booming Hispanic population on American politics has been fully recognized in recent presidential elections. As with religion, Hispanic Americans are becoming less homogeneous politically -- raising concerns among leading Democrats that the Hispanic population's political leanings can no longer be taken for granted. At this point, however, Hispanics still aren't identifying as Republicans in large numbers. The plurality of Hispanics (48%) remain independent of either major political party. Thirty-five percent say they are Democrats, and 18% say they are Republicans. (For an extended analysis on Hispanics and party affiliation, see "Black Support for Bush, GOP Remains Low" in Related Items.)

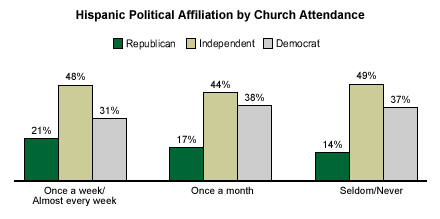
║┌┴¤═°week's recent cover story on Hispanic Americans reports that the connection between religion and politics is particularly troubling to Democratic leaders, who fear religious Hispanics are more likely to identify with conservative values. But are religious Hispanics (as defined by frequent church attendance) more likely than less religious Hispanics (who attend church infrequently) to associate themselves with the GOP?
║┌┴¤═°'s data don't show much difference in political attitudes between religious and non-religious Hispanics. Among Hispanics who attend church once a week or almost every week, 21% are Republicans, 48% are independents, and 31% are Democrats. The numbers shift only slightly among Hispanics who seldom or never attend church -- 14% are Republicans, 49% are independents, and 37% are Democrats.

Bottom Line
The exploding Hispanic population is poised to influence every aspect of American life -- particularly religion and politics. Tracking its varied attitudes and preferences will be a full-time job for demographers, marketers, sociologists, educators, politicians, religious leaders, and virtually everyone else with a long-term stake in American economic and cultural life.
*These results are based on an aggregated sample of 1,007 Hispanic adults, aged 18 and older, from telephone interviews conducted June 9-30, 2004 and June 6-25, 2005. For results based on this sample, one can say with 95% confidence that the maximum error attributable to sampling and other random effects is ┬▒4 percentage points. In addition to sampling error, question wording and practical difficulties in conducting surveys can introduce error or bias into the findings of public opinion polls.
