Last year, according to industry sources, the alcohol industry raked in $145 billion in retail sales as Americans guzzled 7.3 billion gallons of alcoholic beverages. Though margins remain high, the alcohol industry is mature and has seen lackluster growth in recent times. As businesses strive to innovate and look for ways to renew the product life cycle, ║┌┴¤═° data provide some key intelligence on trends and consumer behavior regarding alcohol consumption.
Booze and the Business Cycle
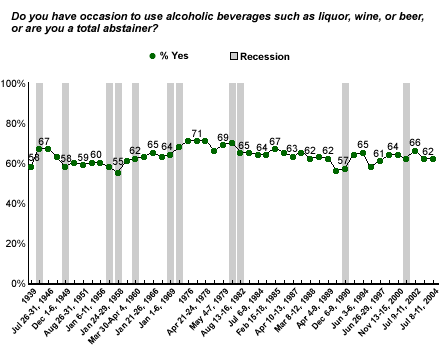
Some analysts argue that the business cycle affects alcohol consumption. Recessions might make customers more price-sensitive, but does the number of drinkers increase during economic hard times? ║┌┴¤═° trend data from 1939 to date, do not suggest a direct relationship between the number of drinkers and the business cycle, although there is some polling evidence that the proportion of Americans who say they drink has risen in the aftermath of some recessions. In four of eight post-World War II recessions for which ║┌┴¤═° has data on alcohol consumption, there were upticks in the number of drinkers in the year following the recession period.
Good Times for the Wine Industry?
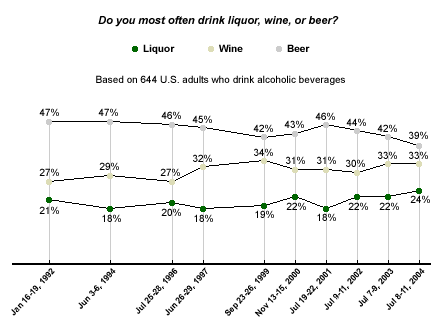
The alcoholic beverage industry might be seeing slow growth, but the same is not true for all categories within the industry. ║┌┴¤═° data suggest that among drinkers, the market for wine has increased over the last decade. In 1992, 27% of U.S. drinkers reported that they drank wine most often. Since 1997, it has been consistently above 30% and in 2004, wine is the beverage of choice for one in every three Americans who drink alcohol. "We are on the verge of launching a true American wine culture," says David Sloane, president of WineAmerica, the National Association of American Wineries in Washington, D.C. Noting the growth the industry has seen in recent years, Sloan says that the United States has around 3,000 wineries in the country today as compared with 1,200 to 1,300 a decade ago.
Although it remains the most popular alcoholic beverage for most Americans, there has been a decline in the number of American drinkers who prefer beer. A decade ago, 47% of American drinkers said they drank beer most often, compared with just 39% today -- the lowest ║┌┴¤═° has measured since 1992. This is in line with industry trends given that wine-industry volumes grew 5% last year, while beer volumes actually fell 1%.
The Market for Alcoholic Beverages
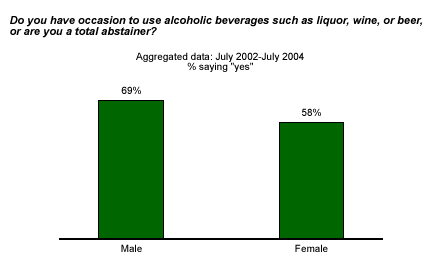
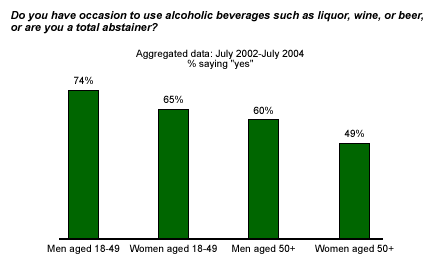
According to data from ║┌┴¤═°'s July 2004 Consumption Habits poll*, more than three in five Americans (62%) consume wine, beer, or spirits. An aggregate ║┌┴¤═° data from 2002 to 2004** provides a clear picture of just who those drinkers are. The average alcohol drinker is more likely to be male than female. While 69% of all men say they drink alcoholic beverages, the same is true for 58% of women. At 74%, a substantial majority of men between the ages of 18 and 50 say they drink. At the other end of the spectrum are women aged 50 and older, of whom only 49% say that they consume alcohol.
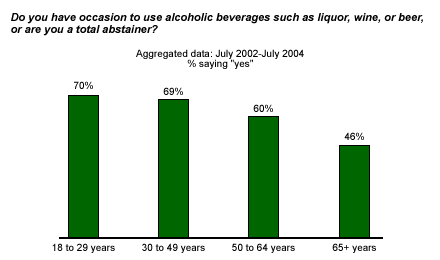
Young American adults (aged 18 to 29) are likely to be drinkers, with 70% of those in this age group saying that they drink at least occasionally. Anishka Clarke, an alcohol industry analyst at Standard & Poor's, says the 21- to 29-year-old age group has become the choice marketing target for not just the traditional beer companies, but for spirits manufacturers as well. Clarke believes that beer companies will continue to face stiff competition, particularly on premise, from the spirits and wine companies as they grapple for the male first-time drinker and for males aged 21 to 29. "Spirits companies have aggressively increased their marketing aimed at this demographic," she says, adding that these companies have also "honed in on" females in this age group.
Unemployed and Need a Drink?
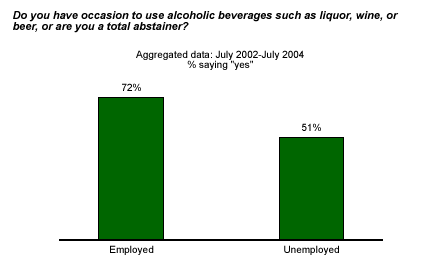
It's also evident from the 2002-2004 aggregate that employed people are more likely to drink than those who are unemployed. While about 7 in 10 employed Americans (72%) drink, only about half (51%) of the unemployed are drinkers. It seems that those on the job seem to have as much or more occasion to drink as those without one.
Bottom Line
║┌┴¤═°'s long-term trend on alcohol consumption peaked in the late 1970s, when 71% of Americans were drinkers, compared with 62% of Americans today. Even as industry majors reconcile to the reality of a declining customer base and look for greener pastures abroad, there are still some rich pickings to be had back home. The domestic market for wine is more robust than ever. While beer is the alcoholic beverage favored by most Americans, the gap between the market preferences for beer over wine is closing rapidly.
The wine industry has responded accordingly, working to come up with product offerings that appeal to a broader range of consumers -- including men who were previously stalwart beer-drinkers. At a time when Americans are becoming increasingly accustomed to luxury-for-less and Trader Joe's grocery stores offer a wine that has come to be known as "Two Buck Chuck," why drink beer if you can have wine?
*Results are based on telephone interviews with 1,005 national adults, aged 18 and older, conducted July 8-11, 2004. For results based on the total sample of national adults, one can say with 95% confidence that the margin of sampling error is ±3 percentage points.
For results based on the 491 national adults in the Form A half-sample and 514 national adults in the Form B half-sample, the maximum margins of sampling error are ±5 percentage points.
For results based on the sample of 644 adults who drink alcoholic beverages, the maximum margin of sampling error is ±4 percentage points.
**Results are based on telephone interviews with 3,016 national adults, aged 18 and older, conducted in July 2002, July 2003, and July 2004.
For results based on the sample of 1,444 men and 1,571 women, the maximum margin of sampling error is ±3 percentage points.
For results based on the sample of 812 men, aged 18-49, 795 women, aged 18 to 49, 619 men, aged 50+, and 763 women, aged 50 and older, the maximum margin of sampling error is ±4 percentage points.
For results based on the sample of 428 adults, aged 18 to 29, the maximum margin of sampling error is ±5 percentage points. For results based on the sample of 1,179 adults, aged 30 to 49, the maximum margin of sampling error is ±3 percentage points. For results based on the sample of 814 adults, aged 50 to 64, the maximum margin of sampling error is ±4 percentage points. For results based on the sample of 568 adults, aged 65 and older, the maximum margin of sampling error is ±4 percentage points.
For results based on the sample of 1,303 employed adults, the maximum margin of sampling error is ±3 percentage points. For results based on the sample of 600 adults who are not employed, the maximum margin of sampling error is ±4 percentage points.
