GALLUP NEWS SERVICE
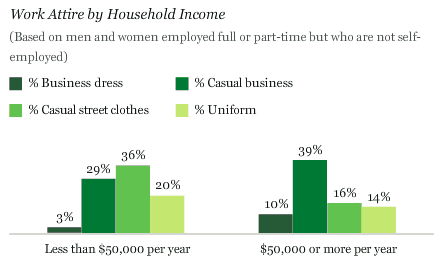
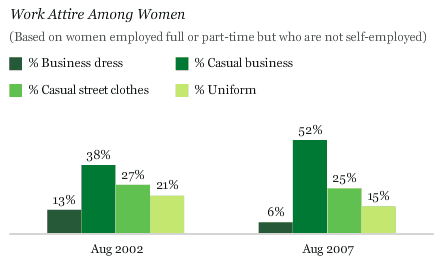
PRINCETON, NJ -- ������'s annual Work and Education poll surveyed American workers about their work clothing. The plurality of workers say they usually wear casual business attire, such as slacks and shirts or skirts and blouses. Casual street clothes, such as jeans or shorts, are the next most common form of work attire, followed by uniforms. Only a small percentage wears formal business clothes, such as a suit or business dress. Women are more likely than men, and higher income workers are more likely than lower income workers, to say the usually wear more professional business clothes to work. Since 2002, there has been a slight uptick -- particularly among women -- in the percentage of workers wearing business casual attire. The percentage of working men who ever wear neckties to work has declined some since 2002.
Specifically, the Aug. 13-17, 2007, poll finds 43% of full or part-time workers who are not self-employed say they wear business casual clothing to work most days, while 28% wear casual street clothes, 19% wear a uniform, and just 9% wear formal business clothing.
������ also asked this question five years ago. Since then, there has been a significant increase in the percentage of workers saying they wear business casual attire to work most days, from 32% to 43%. There has also been a slight decrease in each of the other forms of work attire.
|
Work Attire on Most Days
|
||
|
2007 Aug 13-17 |
2002 Aug 5-8 |
|
|
% |
% |
|
|
Formal business clothes |
9 |
12 |
|
Casual business |
43 |
32 |
|
Casual street clothes |
28 |
32 |
|
Uniform |
19 |
23 |
|
�� |
�� |
|
|
Other/all/mixed (vol.) |
1 |
1 |
|
No opinion |
-- |
-- |
Workers' living in higher income households are more likely than those at lower income levels to wear either formal business or casual business attire. Lower income workers are more likely to wear street clothes or a uniform.

The poll also finds that female workers are slightly more likely than male workers to say they usually wear casual business attire to work, while a higher percentage of men report wearing street clothes or a uniform to work most days.
|
Work Attire on Most Days by Gender
|
||
|
Men |
Women |
|
|
% |
% |
|
|
Formal business clothes |
12 |
6 |
|
Casual business |
34 |
52 |
|
Casual street clothes |
31 |
25 |
|
Uniform |
22 |
15 |
|
�� |
�� |
|
|
Other/all/mixed (vol.) |
1 |
2 |
|
No opinion |
-- |
-- |
This is further underscored by the fact that just 9% of men report wearing a necktie to work most days of the week. An additional 4% say they wear a tie about half the time, and 20% only occasionally wear a tie. More than two in three men never wear a tie to work.
Women are now significantly more likely than they were in 2002 to say they wear casual business clothing to work most days, increasing from 38% in 2002 to 52% in 2007.

There has been little significant change during this period of time in the general type of clothing worn by men to work most days. But, there has been a modest downturn in the percentage of men who ever wear ties to work.
|
Men's Work Attire 2002 vs. 2007
|
|||||
|
2002 |
2007 |
2002 |
2007 |
||
|
% |
% |
% |
% |
||
|
Type of clothes? |
�� |
�� |
Wear necktie? |
�� |
�� |
|
Formal business clothes |
12 |
12 |
Every day |
10 |
6 |
|
Casual business |
26 |
34 |
Most days |
6 |
3 |
|
Casual street clothes |
36 |
31 |
Half the time |
3 |
4 |
|
Uniform |
24 |
22 |
Occasionally |
21 |
20 |
|
�� |
�� |
Never |
59 |
67 |
|
Results are based on telephone interviews with 1,019 national adults, aged 18 and older, conducted Aug. 13-16, 2007. For results based on the total sample of national adults, one can say with 95% confidence that the margin of sampling error is ±3 percentage points.
For results based on the sample of 547 adults employed full or part-time, the maximum margin of sampling error is ±4 percentage points.
For results based on the sample of 233 men employed full or part-time but who are not self-employed, the maximum margin of sampling error is ±7 percentage points.
For results based on the sample of 213 women employed full or part-time but who are not self-employed, the maximum margin of sampling error is ±4 percentage points.
For results based on the sample of 446 men and women employed full or part-time but who are not self-employed, the maximum margin of sampling error is ±4 percentage points.
In addition to sampling error, question wording and practical difficulties in conducting surveys can introduce error or bias into the findings of public opinion polls.
18.
(Asked of men who are employed full or part-time but who are not self-employed) Which of the following best describes the kind of clothes you wear to work most days – [ROTATED: a suit or other professional clothing, a shirt and slacks or other casual business clothes, casual street clothes, such as jeans, shorts or other informal clothes, (or) a uniform]?
BASED ON 233 MEN EMPLOYED FULL OR PART-TIME BUT WHO ARE NOT SELF-EMPLOYED (MoE: ±7 PCT. PTS.)
|
|
|
Casual
|
|
|
All/
|
|
|
|
% |
% |
% |
% |
% |
% |
% |
|
|
2007 Aug 13-16 |
12 |
34 |
31 |
22 |
-- |
1 |
-- |
|
2002 Aug 5-8 |
12 |
26 |
36 |
24 |
* |
2 |
-- |
19.
(Asked of men who are employed full or part-time but who are not self-employed) How often, if ever, do you wear a neck-tie to work – every day, most days, about half the time, only occasionally, or never?
BASED ON 233 MEN EMPLOYED FULL OR PART-TIME BUT WHO ARE NOT SELF-EMPLOYED (MoE: ±7 PCT. PTS.)
|
|
|
|
Only occa-
|
|
Special
|
|
|
|
% |
% |
% |
% |
% |
% |
% |
|
|
2007 Aug 13-16 |
6 |
3 |
4 |
20 |
67 |
-- |
* |
|
2002 Aug 5-8 |
10 |
6 |
3 |
21 |
59 |
* |
1 |
20.
(Asked of women who are employed full or part-time but who are not self-employed)Which of the following best describes the kind of clothes you wear to work most days – [ROTATED: a business dress or other professional clothing, a blouse and a skirt or slacks or other casual business clothes, casual street clothes, such as jeans, shorts or other informal clothes, (or) a uniform]?
BASED ON 213 WOMEN EMPLOYED FULL OR PART-TIME BUT WHO ARE NOT SELF-EMPLOYED (MoE: ±7 PCT. PTS.)
|
|
|
Casual
|
|
|
All/
|
|
|
|
% |
% |
% |
% |
% |
% |
% |
|
|
2007 Aug 13-16 |
6 |
52 |
25 |
15 |
1 |
1 |
-- |
|
2002 Aug 5-8 |
13 |
38 |
27 |
21 |
-- |
1 |
-- |
COMBINED RESPONSES (Q.18/Q.20): BASED ON 446 MEN/WOMEN EMPLOYED FULL OR PART-TIME BUT WHO ARE NOT SELF-EMPLOYED (MoE: ±5 PCT. PTS.)
|
|
|
Casual
|
|
|
All/
|
|
|
|
% |
% |
% |
% |
% |
% |
% |
|
|
2007 Aug 13-17 |
9 |
43 |
28 |
19 |
* |
1 |
-- |
|
2002 Aug 5-8 |
12 |
32 |
32 |
23 |
* |
1 |
-- |
