GALLUP NEWS SERVICE
PRINCETON, NJ -- A ║┌┴¤═° analysis of American public opinion on abortion finds that attitudes are strongly related to both religion and politics. Christians have stronger anti-abortion views than non-Christians, and those who frequently attend church have stronger anti-abortion views than those who attend less frequently. These relationships hold up even within partisan groups. While Republicans as a whole are more likely than Democrats to have anti-abortion views, identifiers with both parties who frequently attend church have stronger anti-abortion views than those who attend less frequently.
Most Americans Are Moderate on Abortion
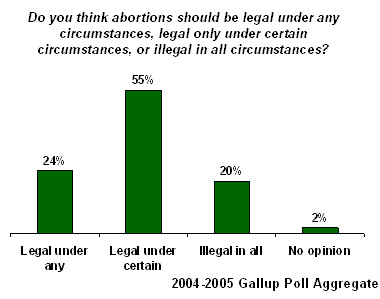
For most of the past 30 years, a majority of Americans have opted for the middle ground in answering ║┌┴¤═°'s long-term measure of abortion attitudes: "Do you think abortions should be legal under any circumstances, legal only under certain circumstances, or illegal in all circumstances?" A special analysis of multiple ║┌┴¤═° Polls conducted over the last two years shows that on average, 55% of Americans said they believed abortion should be legal "only under certain circumstances." As is seen throughout ║┌┴¤═° polling on abortion, Americans are ambivalent about abortion, and this illustrates it.
What has changed over time, and what distinguishes some groups of Americans from others, are the percentages holding the two more extreme positions on the issue. Overall, 24% of Americans in the 2004-2005 aggregate think abortion should be legal "under any circumstances" while 20% think it should be "illegal in all circumstances."
It is the balance of opinion at the extremes that shifts when looking at Americans of different religions and religiosity levels.
Abortion Views by Religious Preference
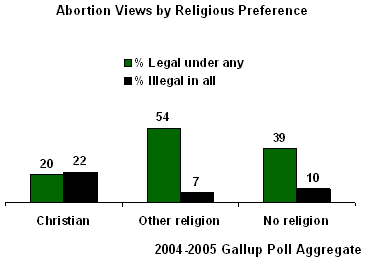
There is a stark difference in views on abortion between Americans who are Christians and those who are not Christians, i.e., those who identify with a non-Christian religion or no religion at all. While just 20% of Christians say abortion should be legal under any circumstances, a majority of non-Christians (54%) and a large segment of those with no religious preference (39%) agree.
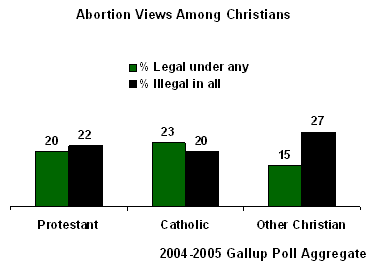
Within the broad group of those who identify themselves as Christians, however, there is little difference between Protestants and Catholics on abortion. In both groups, similar proportions say abortion should be "legal under any circumstances" or "illegal in all circumstances." Other Christians (including Greek Orthodox, Mormons, and those who don't specify their religion beyond "Christian") are a bit more likely to say abortion should be illegal in all circumstances.
Differences by Frequency of Worship
While attitudes toward abortion are similar among broad categories of Christians, there is a significant difference in abortion views among Christians according to their frequency of church attendance.
The percentage of Christians who say abortion should be legal under any circumstances increases from only 9% among those who attend church services weekly to 29% among those who seldom or never attend. On the other hand, the percentage saying that abortion should be illegal in all circumstances decreases from 39% to 11% along with decreasing frequency of church attendance.
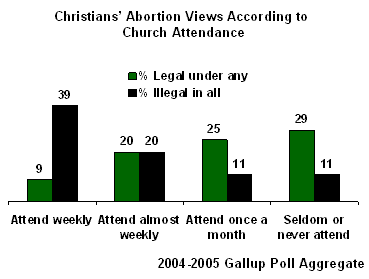
Thus, while the broad type of Christian religion to which one adheres does not seem to affect one's attitude toward abortion, the intensity with which one practices that religion does.
Abortion Attitudes by Party
A majority of both Republicans and Democrats hold moderate views on abortion (saying it should be legal only under certain circumstances), but the balance of attitudes at the extremes between the one partisan group and the other is quite different.
The data confirm what has become conventional political wisdom. Among Republicans, more tend to believe abortion should be illegal in all circumstances than say it should be legal in all circumstances. Among Democrats, more tend to believe it should be legal in all circumstances.
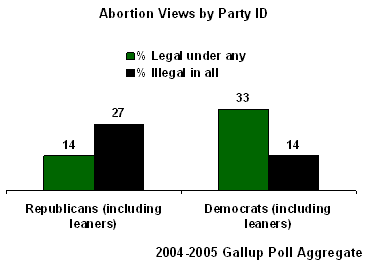
Republicans are more likely to attend church frequently than are Democrats. (Half of Republicans, 51%, attend religious services weekly or nearly weekly, compared with 37% of Democrats.) This fact (that Republicans are on average more religious than Democrats, as measured by church attendance) helps explain at least in part why Republicans have stronger anti-abortion attitudes than Democrats.
But the question remains: Is there still a relationship between religiosity (church attendance) and abortion attitudes within the population of both Republicans and Democrats in this country today?
The answer is a resounding "yes."
Religiously devout members of both parties -- those who attend their places of worship every week -- are much more likely to be opposed to abortion than are less religious members of their own party.
Thus, nearly half of religiously devout Republicans are opposed to abortion in all circumstances, while at the other extreme, only 8% of Democrats who seldom or never attend church are opposed to abortion in all circumstances. The "net legal" index (the percentage saying abortion should be legal in all circumstances minus the percentage saying abortion should be illegal in all circumstances) stretches from -43 points for devout Republicans to +34 points among Democrats who seldom or never attend church.
In short, knowing an individual's frequency of church attendance helps predict his or her attitude toward abortion, above and beyond what can be predicted by knowing that individual's partisan affiliation. Republicans who attend church regularly are the most likely to be anti-abortion, while Democrats who seldom or never attend church are the least likely to be anti-abortion. Both variables are important in understanding the nature of abortion attitudes in America today.
|
Abortion Attitudes by Religious Attendance by Party ID |
|||
|
|
Legal in all |
Illegal in all |
|
|
Attend every week |
% |
% |
pct. pts. |
|
Republicans |
4 |
47 |
-43 |
|
Democrats |
17 |
26 |
-9 |
|
|
|
|
|
|
Almost every week |
|
|
|
|
Republicans |
14 |
25 |
-11 |
|
Democrats |
27 |
18 |
+9 |
|
|
|
|
|
|
Once a month |
|
|
|
|
Republicans |
16 |
17 |
-1 |
|
Democrats |
36 |
8 |
+28 |
|
|
|
|
|
|
Seldom/Never |
|
|
|
|
Republicans |
23 |
10 |
+13 |
|
Democrats |
42 |
8 |
+34 |
Survey Methods
These results are based on an aggregate of 4,015 national adults interviewed across four nationally representative surveys conducted in 2004 and 2005. The interview dates for these were May 2-4, 2004; March 21-23, 2005; May 2-5, 2005; and June 24-26, 2005. For results based on the total combined sample, one can say with 95% confidence that the maximum error attributable to sampling and other random effects is ┬▒2 percentage points. In addition to sampling error, question wording and practical difficulties in conducting surveys can introduce error or bias into the findings of public opinion polls.