GALLUP NEWS SERVICE
PRINCETON, NJ -- The Christmas season seems to be the time of year when Americans shop for nifty gadgets for their friends and family. This year, the gadget receiving the most buzz is the Xbox 360 gaming system, which has sold out in stores around the country and is being auctioned off on eBay and Craigslist for as much as $1,000 each.
║┌┴¤═° recently asked Americans if they personally have each of 17 different technological gadgets. VCRs, DVD players, cell phones, cable television, and desktop computers are the most widely owned electronics, while wireless e-mail devices, satellite radio, and GPS navigation systems are the least common. Younger Americans rather than older Americans, men rather than women, and those in high-income households rather than lower-income households are much more inclined to have many of the items listed in the survey.
Overall Results
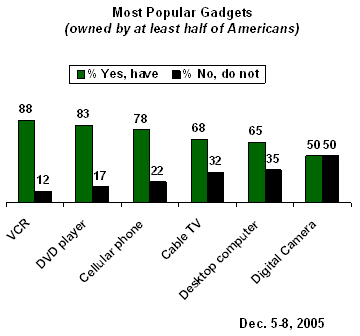
The poll, conducted Dec. 5-8, finds that more than 8 in 10 Americans own a VCR or a DVD player. A large number of Americans -- at least two in three -- report that they have cell phones (78%), cable television (68%), and desktop computers (65%). Half say they have a digital camera.

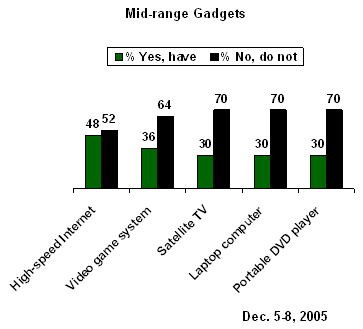
Slightly less than half of Americans, 48%, have high-speed Internet. And, further down the list of electronic devices, ║┌┴¤═° finds that roughly a third of Americans say they currently have satellite television, a laptop computer, a portable DVD player, or a video game system, such as an Xbox or Playstation 2.

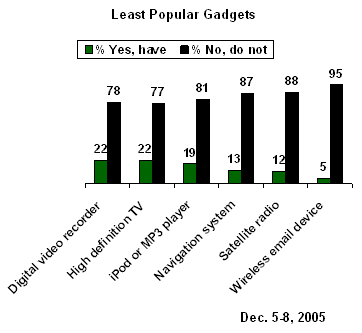
Six of the gadgets inventoried have more niched uses and are owned by fewer than one in four Americans: digital video recorders (22%), high-definition televisions (22%), iPods or MP3 music players (19%), GPS or other navigation systems (13%), satellite radio (12%), or wireless e-mail devices (5%).

Younger vs. Older Americans
The generational gap in having high-tech devices is huge in some cases. Senior citizens are much less likely than those who are younger to have 10 out of the 17 items.
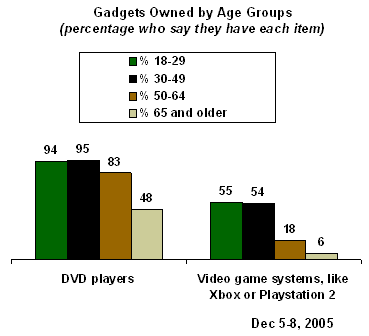
The largest differences between younger and older Americans involve video game systems and DVD players. A majority of Americans under age 50 say they have a video game system. This compares with just 18% of 50- to 64-year-olds and only 6% of those aged 65 and older. This difference may be due to the presence of children in the home, as two in three adults with children under age 18 have a gaming system and only 22% of adults with no children have one. The vast majority of adults under age 65 say they have a DVD player, but less than half of those 65 and older (48%) report having one at the present time.

The poll also finds significant age differences, albeit not nearly as dramatic, regarding the following items:
- Cell phones. More than 8 in 10 Americans between the ages of 18 and 49 say they have a cellular phone. This percentage is lower among 50- to 64-year-olds, at 75%, and among those aged 65 and older, just 54% own a cell phone.
- Desktop computers. Americans in the 30 to 49 age category are the most likely age group to say they have a desktop computer, with 80% saying they have one; two in three adults in the 18 to 29 and the 50 to 64 age categories say they have a desktop computer. Only one in three seniors report having one.
- High-speed Internet. A majority of adults under age 50 say they have high-speed Internet, while 46% of 50- to 64-year-olds and just 18% of adults aged 65 and older have this.
- Digital cameras. Again, those in the 30 to 49 age category are the most likely age group to say they have a digital camera, with 66% reporting this. Fifty-four percent of 18- to 29-year-olds and 47% of 50- to 64-year-olds have a digital camera. Just about one in five seniors have a digital camera.
- Laptop computers. More than 3 in 10 adults under age 65 say they have a laptop computer, while only 8% of seniors do.
- iPod or MP3 music player. Thirty-one percent of adults aged 18 to 29 have an iPod or MP3 music player. This compares with 26% of 30- to 49-year-olds, 11% of 50- to 64-year-olds, and only 2% of adults aged 65 and older.
|
Gadgets by Age Groups |
||||
|
18- to 29-year- olds |
30- to 49-year- olds |
50- to 64-year- olds |
65 years and older |
|
|
% |
% |
% |
% |
|
|
A cellular phone |
86 |
89 |
75 |
54 |
|
A desktop computer |
65 |
80 |
68 |
33 |
|
High-speed Internet, such as DSL or cable |
56 |
61 |
46 |
18 |
|
A digital camera |
54 |
66 |
47 |
22 |
|
A laptop computer |
37 |
39 |
31 |
8 |
|
An iPod or MP3 music player |
31 |
26 |
11 |
2 |
The poll also shows slight age variations in having a portable DVD player, a digital video recorder, or a GPS or other navigation system, with seniors less likely than those are under age 65 to have these devices.
|
Gadgets by Age Groups |
||||
|
18- to 29-year- olds |
30- to 49-year- olds |
50- to 64-year- olds |
65 years and older |
|
|
% |
% |
% |
% |
|
|
A portable DVD player |
31 |
38 |
28 |
17 |
|
A digital video recorder or Tivo |
25 |
26 |
20 |
12 |
|
GPS or other navigation system |
14 |
17 |
13 |
5 |
There are essentially no age differences for owning a VCR, cable or satellite television, high-definition television, satellite radio, or wireless e-mail devices.
Men vs. Women
Men are more likely than women to have 9 of the 17 items in the list, and women are no more likely than men to have any of these items.
|
Gadgets by Gender |
|||
|
Men |
Women |
Difference |
|
|
% |
% |
|
|
|
A digital camera |
57 |
44 |
+13 |
|
A laptop computer |
36 |
25 |
+11 |
|
A GPS or other navigation system |
19 |
8 |
+11 |
|
A desktop computer |
70 |
61 |
+9 |
|
A video game system, such as XBox or Playstation 2 |
41 |
32 |
+9 |
|
A cellular phone |
82 |
74 |
+8 |
|
High-speed Internet, such as DSL or cable |
51 |
45 |
+6 |
|
Satellite TV |
33 |
27 |
+6 |
|
A digital video recorder or Tivo |
25 |
19 |
+6 |
|
A high-definition TV |
25 |
20 |
+5 |
|
A wireless e-mail device, such as Blackberry or Treo |
7 |
3 |
+4 |
|
A VCR |
90 |
87 |
+3 |
|
A DVD player |
84 |
81 |
+3 |
|
Cable TV |
69 |
67 |
2 |
|
A portable DVD player |
31 |
30 |
1 |
|
Satellite radio |
12 |
11 |
1 |
|
An iPod or MP3 music player |
18 |
19 |
-1 |
As the table illustrates, men are more likely than women to have the following gadgets: digital cameras (57% to 44%, respectively), laptop computers (36% to 25%), GPS or other navigation systems (19% to 8%), desktop computers (70% to 61%), video game systems (41% to 32%), and cellular phones (82% to 74%). Men are slightly more likely to have high-speed Internet, satellite television, digital video recorders, or high-definition television.
Men and women are just as likely to have wireless e-mail devices, VCRs, DVD players, cable television, portable DVD players, satellite radio, or MP3 players.
Higher-Income Households vs. Lower-Income Households
With the exception of video game systems and satellite television, Americans living in households earning $75,000 or more per year are more likely than those in households earning less than that to have all of these items in the table below. (The data show only modest variations by household income in having a video game system and satellite television.)
|
Gadgets by Household Income |
|||
|
Less than $30,000 per year |
$30,000-$74,999 |
$75,000 or more per year |
|
|
% |
% |
% |
|
|
A VCR |
77 |
92 |
94 |
|
Cable TV |
64 |
63 |
76 |
|
A DVD player |
63 |
86 |
97 |
|
A cellular phone |
49 |
85 |
96 |
|
A desktop computer |
40 |
70 |
87 |
|
A video game system, such as Xbox or Playstation 2 |
32 |
40 |
38 |
|
Satellite TV |
26 |
35 |
31 |
|
High-speed Internet, such as DSL or cable |
23 |
49 |
74 |
|
A digital camera |
21 |
53 |
80 |
|
A portable DVD player |
21 |
30 |
43 |
|
A digital video recorder or Tivo |
17 |
17 |
36 |
|
A high-definition TV |
13 |
19 |
37 |
|
A laptop computer |
12 |
30 |
54 |
|
An iPod or MP3 music player |
10 |
16 |
34 |
|
Satellite radio |
9 |
10 |
19 |
|
A GPS or other navigation system |
6 |
12 |
25 |
|
A wireless e-mail device, such as Blackberry or Treo |
2 |
4 |
12 |
The most significant difference is found in having a digital camera. Eighty percent of those earning $75,000 or more say they have a digital camera, compared with 53% of those earning between $30,000 and $75,000 and just 21% of those earning less than that.
The survey also finds large income differences in having high-speed Internet (74% among those earning $75,000 or more to 49% among those earning between $30,000 and $75,000 to 23% among those earning less than $30,000), a desktop computer (87% to 70% to 40%), a cell phone (96% to 85% to 49%), and a laptop computer (54% to 30% to 12%).
Survey Methods
Results are based on telephone interviews with 1,013 national adults, aged 18 and older, conducted Dec. 5-8, 2005. For results based on the total sample of national adults, one can say with 95% confidence that the maximum margin of sampling error is ┬▒3 percentage points. In addition to sampling error, question wording and practical difficulties in conducting surveys can introduce error or bias into the findings of public opinion polls.
