GALLUP NEWS SERVICE
PRINCETON, NJ - As Americans sit down to Thanksgiving dinner with all of the trimmings, one thing for which they can be thankful is that the American public doesn't seem to have grown any heavier over the past year. In fact, for each of the past five years, the average weight reported by Americans in ║┌┴¤═°'s annual Health survey has been between 171 and 174 pounds. This year's figure of 173 is identical to what was recorded in 2004.
That is small solace to the majority of the nation's adults who are either overweight or obese. According to respondents' self-reports of their current height and weight in ║┌┴¤═°'s Nov. 7-10 survey, 21% of Americans are obese, 36% are overweight, 32% are normal, and 7% are underweight. These classifications conform to the standard body mass index (BMI) categories used by the National Institutes of Health for evaluating weight. A person's BMI score is based on a ratio of their weight and height (see Related Items).
The average weight of American men is 193 pounds; the average weight of American women is 154. Americans weighed a bit less in 1990, when ║┌┴¤═° first measured this. At that time, the average man weighed 180 and the average woman weighed 142. By 1999, these figures had jumped by 8 to 10 pounds, and they are now just slightly higher.
|
Average Body Weight (In Pounds) |
|||
|
National adults |
Women |
Men |
|
|
2005 |
173 |
154 |
193 |
|
2004 |
173 |
156 |
191 |
|
1999 |
170 |
150 |
190 |
|
1990 |
161 |
142 |
180 |
Americans Resist "Overweight" Label
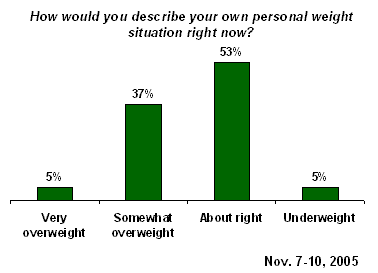
Americans largely fail to acknowledge their weight problem, particularly when it comes to obesity. Whereas 21% of Americans today report height and weight measurements that put them in the government's obese category (and this is based on ║┌┴¤═°'s self-reported data; federal statistics put the figure at 30%), only 5% of Americans describe themselves as "very overweight."
With another 37% calling themselves "overweight," this amounts to only 42% of Americans who consider themselves overweight to any degree. This contrasts with 57% who are overweight according to their ║┌┴¤═° BMI index (and with 65% who are overweight according to government data).

A Veritable Stew of Risk Factors
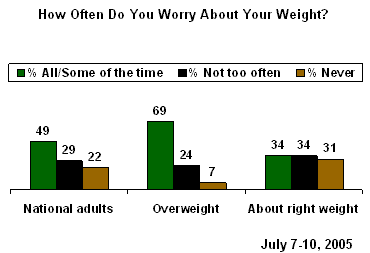
Stress and good health don't mix, so it is of potential concern that the vast majority of overweight Americans say they worry about their weight.
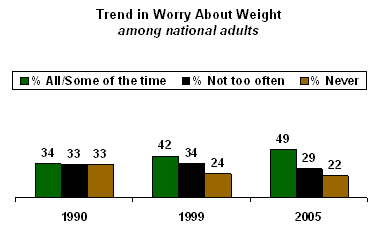
Close to half of all Americans say they worry all or some of the time about their weight. This jumps to 69% among those who describe themselves as overweight.

All of that worrying might be beneficial if it resulted in successful weight reduction. But the data on this are not encouraging. Since 1990, the percentage of Americans worrying about their weight has increased from 34% to 49%. At the same time, Americans' average weight has risen by 12 pounds (from 161 to 173).

The Catch-22 of being overweight is that one needs to exercise to lose weight, but it can be hard to exercise when overweight. ║┌┴¤═°'s Health survey includes questions on people's activity level that are summarized in an exercise index. Overall, 29% of Americans score as high activity, 19% as medium activity, 24% as low activity, and 27% as sedentary.
However, there are some differences by weight. The majority of overweight Americans (60%) fall into the low activity or sedentary categories, while the majority of those who are about the right weight (55%) score as high or moderate activity.
|
Exercise Index |
|||
|
|
National |
Overweight |
About |
|
% |
% |
% |
|
|
High activity |
29 |
23 |
35 |
|
Moderate activity |
19 |
17 |
20 |
|
Low activity |
24 |
26 |
23 |
|
Sedentary |
27 |
34 |
21 |
|
|
|
|
|
|
Total high/moderate |
48 |
40 |
55 |
|
Total low/sedentary |
51 |
60 |
44 |
Dieting Picks Up
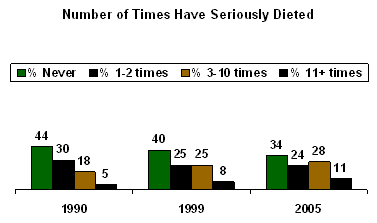
Perhaps Americans are more worried about their weight today than in the past because they have experienced more dieting failures. ║┌┴¤═° has periodically asked Americans to estimate how many different times they have seriously tried to lose weight. The average number was only 4.0 in 1990. This increased to 4.6 in 1999, and is now 7.3.

A Gender Imbalance
While men and women are about equally likely to consider themselves overweight, men are substantially more likely than women to be classified as obese or overweight according to their BMI: 70% of men fall into these categories, compared with 44% of women.
In spite of this, it is women who are most likely to be worried about their weight. Nearly 6 in 10 women (57%) worry about it all or some of the time, compared with only 39% of men. Women are also much more likely to be on a dieting treadmill: they report an average of 9.6 serious attempts at losing weight, compared with 5.0 attempts for men. At present, 30% of women versus 23% of men say they are seriously trying to lose weight.
|
|
% over- |
% over- |
% worry |
% trying |
Mean |
|
Men |
41 |
70 |
39 |
23 |
5.0 |
|
Women |
44 |
44 |
57 |
30 |
9.6 |
Survey Methods
These results are based on telephone interviews with a randomly selected national sample of 1,011 adults, aged 18 and older, conducted Nov. 7-10, 2005. For results based on this sample, one can say with 95% confidence that the maximum error attributable to sampling and other random effects is ┬▒3 percentage points. In addition to sampling error, question wording and practical difficulties in conducting surveys can introduce error or bias into the findings of public opinion polls.
22. How would you describe your own personal weight situation right now -- very overweight, somewhat overweight, about right, somewhat underweight, or very underweight?
|
|
Very |
Some- |
About |
Some- |
Very |
No |
|
% |
% |
% |
% |
% |
% |
|
|
2005 Nov 7-10 |
5 |
37 |
53 |
4 |
1 |
* |
|
|
|
|
|
|
|
|
|
2005 Jul 7-10 |
4 |
38 |
52 |
5 |
1 |
* |
|
2004 Nov 7-10 |
5 |
36 |
54 |
5 |
* |
* |
|
2004 Jul 8-11 |
5 |
39 |
50 |
5 |
1 |
* |
|
2003 Nov 3-5 |
4 |
37 |
53 |
5 |
1 |
* |
|
2003 Jul 7-9 |
4 |
39 |
50 |
5 |
1 |
1 |
|
2002 Nov 11-14 |
6 |
36 |
51 |
5 |
1 |
1 |
|
2002 Jul 9-11 |
6 |
34 |
55 |
5 |
* |
* |
|
2001 Nov 8-11 |
6 |
38 |
51 |
4 |
* |
1 |
|
2001 Jul 19-22 |
5 |
41 |
49 |
5 |
* |
* |
|
1999 Jul 22-25 |
4 |
35 |
53 |
6 |
1 |
1 |
|
1990 Oct 18-21 |
7 |
41 |
46 |
5 |
1 |
* |
|
* Less than 0.5% |
||||||
23. What is your approximate current weight?
|
|
124 lbs. |
125-149 |
150-174 |
175-199 |
200 lbs. |
No |
Avg. |
|
National adults |
% |
% |
% |
% |
% |
% |
% |
|
2005 Nov 7-10 |
9 |
19 |
24 |
19 |
25 |
4 |
173 |
|
2004 Nov 7-10 |
8 |
19 |
25 |
20 |
24 |
4 |
173 |
|
2003 Nov 3-5 |
8 |
21 |
21 |
22 |
24 |
4 |
174 |
|
2002 Nov 11-14 |
9 |
22 |
22 |
18 |
25 |
4 |
173 |
|
2001 Nov 8-11 |
8 |
20 |
24 |
22 |
22 |
4 |
171 |
|
2001 Jul 19-22 |
8 |
19 |
26 |
20 |
22 |
5 |
173 |
|
1999 Jul 22-25 |
11 |
19 |
25 |
20 |
20 |
4 |
170 |
|
1990 Oct 18-21 |
12 |
27 |
27 |
16 |
15 |
3 |
161 |
|
|
|
|
|
|
|
|
|
|
Men |
|
|
|
|
|
|
|
|
2005 Nov 7-10 |
1 |
7 |
24 |
27 |
40 |
1 |
193 |
|
2004 Nov 7-10 |
* |
7 |
23 |
30 |
39 |
1 |
191 |
|
2003 Nov 3-5 |
1 |
7 |
19 |
34 |
38 |
1 |
195 |
|
2002 Nov 11-14 |
1 |
8 |
25 |
24 |
41 |
1 |
193 |
|
2001 Nov 8-11 |
1 |
8 |
22 |
33 |
35 |
1 |
189 |
|
2001 Jul 19-22 |
3 |
8 |
26 |
28 |
34 |
1 |
188 |
|
1999 Jul 22-25 |
1 |
6 |
27 |
31 |
33 |
2 |
190 |
|
1990 Oct 18-21 |
2 |
11 |
35 |
27 |
25 |
* |
180 |
|
|
|
|
|
|
|
|
|
|
Women |
|
|
|
|
|
|
|
|
2005 Nov 7-10 |
17 |
30 |
24 |
11 |
12 |
6 |
154 |
|
2004 Nov 7-10 |
16 |
29 |
27 |
11 |
11 |
6 |
156 |
|
2003 Nov 3-5 |
15 |
34 |
23 |
10 |
11 |
6 |
153 |
|
2002 Nov 11-14 |
15 |
35 |
21 |
12 |
10 |
7 |
153 |
|
2001 Nov 8-11 |
15 |
31 |
26 |
11 |
11 |
6 |
153 |
|
2001 Jul 19-22 |
13 |
29 |
26 |
12 |
12 |
8 |
158 |
|
1999 Jul 22-25 |
20 |
32 |
24 |
9 |
8 |
7 |
150 |
|
1990 Oct 18-21 |
21 |
42 |
20 |
7 |
5 |
5 |
142 |
|
* Less than 0.5% |
|||||||
24. What is your approximate current height?
|
|
5'0" or |
5'1"- |
5'4"- |
5'7"- |
5'9"- |
6'0"- |
6'4" |
No |
Avg. |
|
National adults |
|
|
|
|
|
|
|
|
|
|
2005 Nov 7-10 |
4 |
16 |
24 |
16 |
21 |
17 |
2 |
* |
5'7" |
|
2004 Nov 7-10 |
2 |
17 |
25 |
14 |
23 |
17 |
1 |
1 |
5'7" |
|
2003 Nov 3-5 |
4 |
13 |
26 |
15 |
23 |
15 |
3 |
2 |
5'7" |
|
2001 Nov 8-11 |
3 |
15 |
27 |
16 |
20 |
15 |
3 |
1 |
5'8" |
|
% |
% |
% |
% |
% |
% |
% |
% |
% |
|
|
Men |
|
|
|
|
|
|
|
|
|
|
2005 Nov 7-10 |
1 |
2 |
8 |
17 |
34 |
35 |
3 |
* |
5'10" |
|
2004 Nov 7-10 |
* |
2 |
7 |
14 |
40 |
34 |
2 |
1 |
5'10" |
|
2003 Nov 3-5 |
* |
1 |
9 |
13 |
39 |
31 |
6 |
1 |
5'10" |
|
2001 Nov 8-11 |
-- |
1 |
7 |
17 |
36 |
31 |
7 |
1 |
5'11" |
|
|
|
|
|
|
|
|
|
|
|
|
Women |
|
|
|
|
|
|
|
|
|
|
2005 Nov 7-10 |
7 |
29 |
40 |
14 |
9 |
* |
-- |
1 |
5'5" |
|
2004 Nov 7-10 |
3 |
32 |
40 |
15 |
8 |
1 |
-- |
1 |
5'5" |
|
2003 Nov 3-5 |
7 |
24 |
41 |
18 |
7 |
1 |
-- |
3 |
5'4" |
|
2001 Nov 8-11 |
5 |
28 |
44 |
16 |
6 |
* |
* |
1 |
5'5" |
|
* Less than 0.5% |
|||||||||
BODY MASS INDEX (Q.23-24)
|
|
< 20 |
20-25 |
26-30 |
30+ |
Mis- |
Mean |
Median |
|
National adults |
% |
% |
% |
% |
% |
% |
% |
|
2005 Nov 7-10 |
7 |
32 |
36 |
21 |
4 |
27 |
26 |
|
2004 Nov 7-10 |
6 |
32 |
39 |
20 |
3 |
27 |
26 |
|
2003 Nov 3-5 |
4 |
36 |
35 |
20 |
5 |
27 |
26 |
|
2001 Nov 8-11 |
5 |
36 |
36 |
18 |
5 |
27 |
26 |
|
|
|
|
|
|
|
|
|
|
Men |
|
|
|
|
|
|
|
|
2005 Nov 7-10 |
2 |
26 |
47 |
23 |
2 |
28 |
27 |
|
2004 Nov 7-10 |
2 |
28 |
50 |
18 |
2 |
27 |
26 |
|
2003 Nov 3-5 |
3 |
28 |
45 |
23 |
1 |
27 |
27 |
|
2001 Nov 8-11 |
3 |
32 |
46 |
17 |
2 |
26 |
26 |
|
|
|
|
|
|
|
|
|
|
Women |
|
|
|
|
|
|
|
|
2005 Nov 7-10 |
11 |
39 |
26 |
18 |
6 |
26 |
24 |
|
2004 Nov 7-10 |
9 |
35 |
29 |
21 |
6 |
26 |
25 |
|
2003 Nov 3-5 |
6 |
43 |
26 |
17 |
8 |
26 |
24 |
|
2001 Nov 8-11 |
6 |
39 |
28 |
19 |
8 |
27 |
25 |
|
|
|
|
|
|
|
|
|
|
NOTE: Body mass index is calculated as follows: (weight in pounds ├Ě (height in inches x height in inches)) x 703. |
|||||||
40. How would you describe your own personal weight situation right now -- very overweight, somewhat overweight, about right, somewhat underweight, or very underweight?
|
|
Very |
Some- |
About |
Some- |
Very |
No |
|
|
|
|
|
|
|
|
|
2005 Jul 7-10 |
4 |
38 |
52 |
5 |
1 |
* |
|
|
|
|
|
|
|
|
|
2004 Nov 7-10 |
5 |
36 |
54 |
5 |
* |
* |
|
2004 Jul 8-11 |
5 |
39 |
50 |
5 |
1 |
* |
|
2003 Nov 3-5 |
4 |
37 |
53 |
5 |
1 |
* |
|
2003 Jul 7-9 |
4 |
39 |
50 |
5 |
1 |
1 |
|
2002 Nov 11-14 |
6 |
36 |
51 |
5 |
1 |
1 |
|
2002 Jul 9-11 |
6 |
34 |
55 |
5 |
* |
* |
|
2001 Nov 8-11 |
6 |
38 |
51 |
4 |
* |
1 |
|
2001 Jul 19-22 |
5 |
41 |
49 |
5 |
* |
* |
|
1999 Jul 22-25 |
4 |
35 |
53 |
6 |
1 |
1 |
|
1990 Oct 18-21 |
7 |
41 |
46 |
5 |
1 |
* |
|
* Less than 0.5% |
||||||
41. How often do you worry about your weight? Would you say you worry all of the time, some of the time, not too often or never?
|
|
All of |
Some of |
Not |
Never |
No |
|
National adults |
% |
% |
% |
% |
% |
|
2005 Jul 7-10 |
15 |
34 |
29 |
22 |
* |
|
1999 Jul 22-25 |
15 |
27 |
34 |
24 |
* |
|
1990 Oct 11-14 |
7 |
27 |
33 |
33 |
* |
|
|
|
|
|
|
|
|
Men |
|
|
|
|
|
|
2005 Jul 7-10 |
8 |
31 |
29 |
31 |
1 |
|
1999 Jul 22-25 |
10 |
21 |
41 |
28 |
* |
|
1990 Oct 11-14 |
2 |
19 |
33 |
46 |
* |
|
|
|
|
|
|
|
|
Women |
|
|
|
|
|
|
2005 Jul 7-10 |
20 |
37 |
28 |
15 |
-- |
|
1999 Jul 22-25 |
20 |
32 |
29 |
19 |
-- |
|
1990 Oct 11-14 |
13 |
33 |
32 |
22 |
* |
|
* Less than 0.5% |
|||||
42. How many different times, if any, have you seriously tried to lose weight in your life?
|
|
Once or |
3-10 |
More than |
Never |
No |
Mean |
|
National adults |
% |
% |
% |
% |
% |
|
|
2005 Jul 7-10 |
24 |
28 |
11 |
34 |
3 |
7.3 |
|
1999 Jul 22-25 |
25 |
25 |
8 |
40 |
2 |
4.6 |
|
1990 Oct 18-21 |
30 |
18 |
5 |
44 |
3 |
4.0 |
|
|
|
|
|
|
|
|
|
Men |
|
|
|
|
|
|
|
2005 Jul 7-10 |
22 |
24 |
7 |
45 |
2 |
5.0 |
|
1999 Jul 22-25 |
24 |
19 |
7 |
49 |
1 |
3.1 |
|
1990 Oct 18-21 |
28 |
10 |
1 |
59 |
2 |
1.4 |
|
|
|
|
|
|
|
|
|
Women |
|
|
|
|
|
|
|
2005 Jul 7-10 |
25 |
31 |
15 |
24 |
5 |
9.6 |
|
1999 Jul 22-25 |
26 |
30 |
10 |
31 |
3 |
6.0 |
|
1990 Oct 18-21 |
32 |
25 |
8 |
31 |
4 |
6.5 |
